Damage rate equation or the rate of displacement is given by:
\[R_{d} = N \int_{\breve{E}}^{\hat{E}} \phi(E_{i}) \sigma_{D} (E_{i}) dE_{i}\]where \(N\) is the lattice atom density, \(\phi(E_{i})\) is the energy dependent particle flux and typically has units of per \(\text{cm}^{2}\) per second, , \(\sigma(E_{i})\) is the energy dependent cross section of the incident particle.
From here, the displacement per atom (dpa) can be written in terms of the Damage rate,
\[dpa = \frac{R_{d} t}{N}\]The energy dependent displacement cross section can be fully defined as:
\[\sigma_{D} (E_{i}) = \int_{\breve{T}}^{\hat{T}} \sigma(E_{i},T) \nu(T) dT\]where \(\sigma(E_{i}, T)\) is the probability that a particle of energy \(E_{i}\) will implant recoil energy \(T\) to a struck lattice atom, and \(\nu(T)\) is the number of displacement atoms of a collision resulting from a primary recoil atom of energy \(T\)
The simplified displacement probability for the simple case can can be approximated as a step function,
\[P_{d} (T) = \begin{cases} 0 & T < E_{d} \\ 1 & T > E_{d} \end{cases}\]However, a more realistic model can be modeled after,
\[P_{d} (T) \begin{cases} =0 & T < E_{d min} \\ =f(T) & E_{d min} < T < E_{d max} \\ =1 & T <E_{d max} \end{cases}\]Displacement threshold energies (\(E_{d}\)) for different materials are as follows:
| Element | Cu | Al | Au | Pt | Ni | Fe | Mo |
|---|---|---|---|---|---|---|---|
| \(E_{d}\) (\(eV\)) | 22 | 16 | 36 | 37 | 24 | 24 | 37 |
since things need to be accounted for…
The following assumptions are made for the average number of displaced atoms initially created by a PKA of energy T:
In accordance to the Kinchin-Pease Model, \(\nu (T)\) is defined as,
\[\nu (T) = \frac{T}{2 E_{d}}\]Rutherford Backscattering Spectrometry (RBS) describes a technique commonly used for surface layer analysis of solids such as composition analysis, stoichiometry, and depth profiling for films less than 1 \(\mu\)m thin.
Using high energy \(He^{2+}\) ions or \(\alpha\) particles beams up to 2 MeV, the energy of the recoiled ion at a given angle is measured. Much like its namesake, RBS involves elastic hard sphere scattering using a high energy incident particles or beam (in this case, an ion beam).
The energy of the backscatted particle \(E_{1}\) at a scattering angle \(\theta_{1}\) relative to the observer is written in terms of the energy of the incident particle \(E_{0}\) as:
\[E_{1} = k E_{0}\]where \(k\) is the kinematical factor, which can be expanded:
\[k = \bigg( \frac{m_{1} \cos(\theta_{1}) \pm \sqrt{m_{2}^{2} - m_{1}^{2} (\sin(\theta_{1})^{2}} }{ m_{1} + m_{2} } \bigg)^{2}\]The probability of scattering is proportional to the atomic numbers of both the incident and target particle, written with a center-of-mass reference fram in mind:
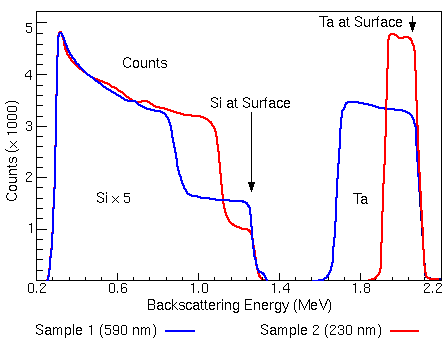
\[\frac{d\omega}{d\Omega} = \bigg( \frac{Z_{1} Z_{2}}{4 E_{0}} \bigg)^{2} \frac{1}{(\sin\theta/2)^{2}}\]Below is an example of an RBS spectrum comparing two Tantalum-Silicon (TaSi) thin films of different thickness at an ion beam of 2.2 MeV. As shown below, the peaks appear at a lower energy than the initial beam energy (\(E_0\)) as the backscatted ions lose energy as they scatter and travel through the sample. Note that the silicon peaks have been multiplied by 5 to distinguish its features.
The tantalum peak appears at a much higher energy since it has a larger cross section than silicon. The leading edge of each energy peak corresponds to the backscattering of each element at the surface.
Furthermore, the thickness of the TaSi sample can be measured via the width of the energy peaks. Dividing the energy width
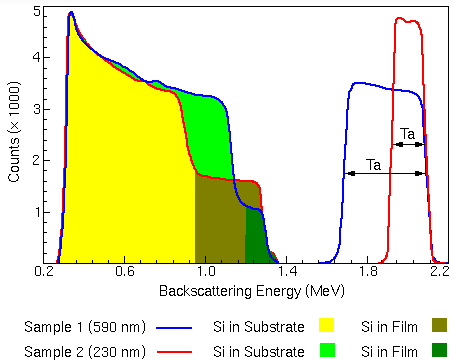
The wider energy peak belongs to the thicker 590 nm sample since the backscattered ions have more material to travel through.
The trailing edge of the energy peaks corresponds to scattering at the interface of the Ta. The 230 nm layer film has an energy of ~1.9 MeV while the 590 nm layer has an energy of ~1.5 MeV.
Recall that the change in Gibbs free energy \(\Delta G = \Delta H - T \Delta S\) is the maximum amount of non-expansion work that can be extracted from a closed system. In other words, \(\Delta G\) represents the amount of “free” or “useful” energy available to do non-\(PV\) work at constant pressure and temperature In other words, \(\Delta G\) represents the amount of “free” or “useful” energy available to do non-\(PV\) work at constant pressure and temperature.
Suppose two pure elements \(A\) and \(B\) were combined. The alloy can become a solid solution or form an intermetallic phase with the corresponding free energies:
For solutions, \(\Delta G_{mix} = \Delta H_{mix} - T \Delta S_{mix}\)
For intermetallic phases: \(\Delta G_{f} = \Delta H_{f} - T \Delta S_{f}\)
where \(H_{mix}\) and \(S_{mix}\) are the enthalpy and entropy of mixing, and \(H_{f}\) and \(S_{f}\) refer to the values for the formation of an intermetallic compound with \(AB\) stoichiometry. \(T\) is the absolute temperature. That being said, for more complex stoichiometries such as \(AB_{2}\) or \(A_{2} B\), will involve additional expressions in \(\Delta G_{f}\) for each compound.
The ideal entropy of mixing is given by
\[\Delta S_{mix} = - R \sum_{i} x_{i} ln x_{i}\]where \(R\) is the gas constant and \(x_{i}\) is the mole fraction of the \(i-th\) element. For equiatomic alloys, where \(x_{1} = x_{2} = x_{3} = ...\), the entropy of mixing becomes,
\[\Delta S_{mix} = R ln n\]which simplifies \(\Delta S_{mix}\) to constant values related to the number of elements \(n\). For 4, 5, and 6 elements, \(\Delta S_{mix}\) corresponds to \(1.39R\), \(1.61R\), and \(1.79R\).
In a paper by Yeh et al., they proposed that adding more elements at near equiatomic concentrations would stabilize solid solutions at the expense of intermetallic compounds. This was done by increasing the configurational entropy of mixing in alloys in solid solutions, counteracting the formation of compounds.
For alloys with a high number of principle elements, such as \(n=5\), the entropic contribution terms at melting temperatures \(T_{melt} \Delta S_{mix}\) becomes comparable to the formation enthalpies \(\Delta H_{f}\) of intermetallic compounds, supressing compound formation
[2] EAG RBS
[3] [Chem Libretexts](https://chem.libretexts.org/Bookshelves/Analytical_Chemistry/Physical_Methods_in_Chemistry_and_Nano_Science_(Barron)/01%3A_El